Recovering 433MHz Messages with RTL-SDR and MATLAB
Posted 2015/02/13. Last updated 2015/02/17.
Introduction
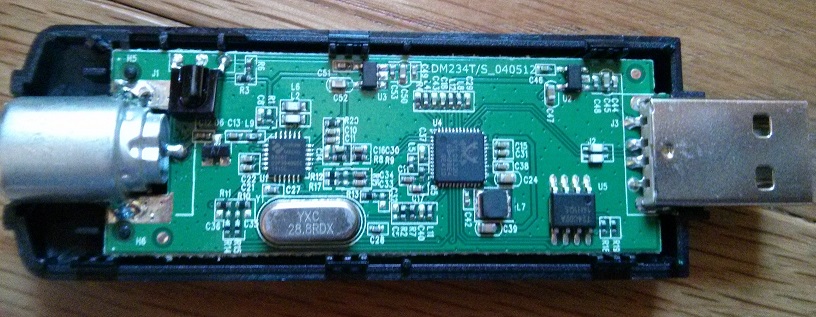
I recently bought a DVB-T dongle containing the Realtek RTL2832U and Raphael Micro R820T chips with the intent to use it as a Software-Defined Radio (SDR) receiver. These dongles are incredible because for about $10, you can tune in to frequencies between 24 and 1766MHz and listen to a wide range of devices and signals, provided you have a proper antenna (and a down-/up- converter if you want to listen outside of this range). The device, pictured below, is truly very simple: the back consists solely of a couple lines that could probably not be routed on the top layer of the PCB.
As a first project, I decided to look into the 433MHz frequency, as others have also successfully done (see here, here, and here for instance), but decided to focus on the methodology and the tools available, rather than recovering a specific device's key, since I didn't have one lying around. This post describes the manual process I followed with existing tools, as well as a basic MATLAB script that I wrote interfacing with the RTL device which automates the binary signal recovery process.
UPDATE: There is some good discussion of this post going on at Hackaday, RTL-SDR, and Reddit, which also contain a few more pointers for this kind of thing. My response to some of the points raised can be found here. A good alternative to MATLAB which I had not considered is Octave, which apparently interfaces well with GNU Radio.
Setup
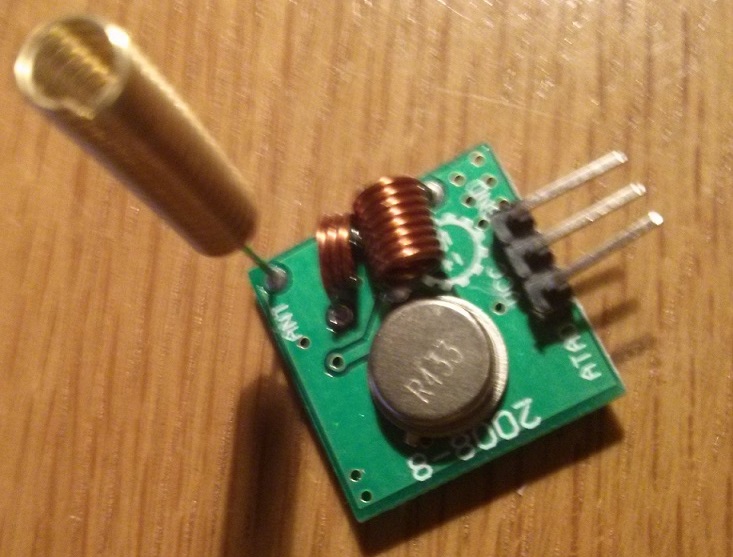
As mentioned above, I did not have a device transmitting at 433MHz, so instead I used a typical cheap MX-FS-03V RF transmitter (pictured below) bought off of EBay, connected to an Arduino Uno. I used the rc-switch library, which appears to be pretty popular, with a lot of forks on GitHub. My code's loop simply calls mySwitch.send("010010100101") followed by a delay of 1 second and makes no other calls to the library besides enabling transmission on the appropriate Arduino pin.
The goal of the project was to uncover the details of the protocol (and the value transmitted) before looking at the library code to verify it. To this end, I installed SDR# to visualize and record the signal, as well as Audacity to inspect the produced WAV file. I additionally installed the rtl-sdr and rtl_433 libraries which contain command-line utilities for automation (Windows binaries can be found here and here).
Tuning In
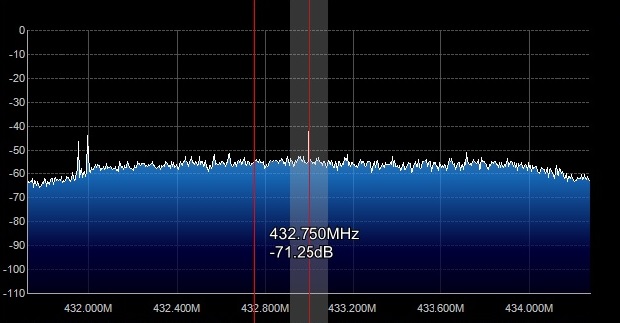
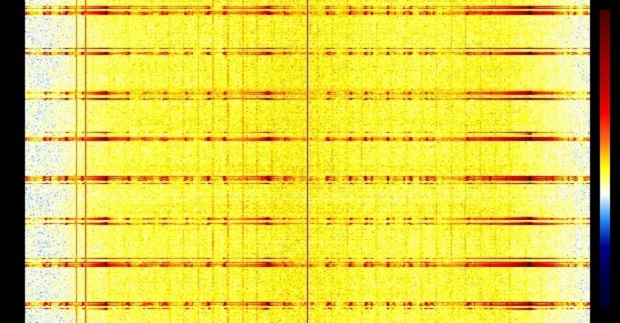
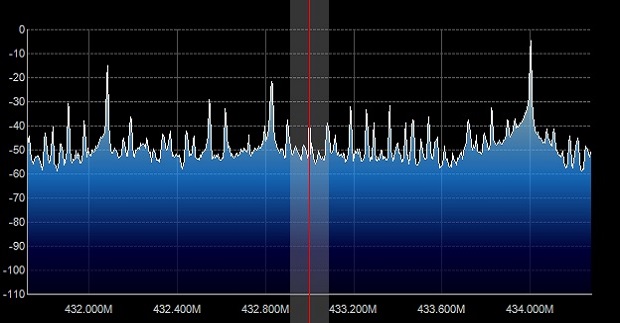
Having programmed the Arduino and left it to constantly transmit, my first step was to fire up SDR# to visually inspect the signal. The figures below show SDR#'s spectrum analyzer and waterfall graphs centered at 433MHz. The spectrum analyzer shows a consistent noise level across frequencies when the transmitter is silent, and also indicates a few DC bias spikes. Moreover, the waterfall illustrates that the transmitter output is not filtered and produces noise/energy across many unwanted frequencies. [UPDATE: Per a suggestion here, reducing the gain helps remove the aliases, but does not entirely eliminate them.]
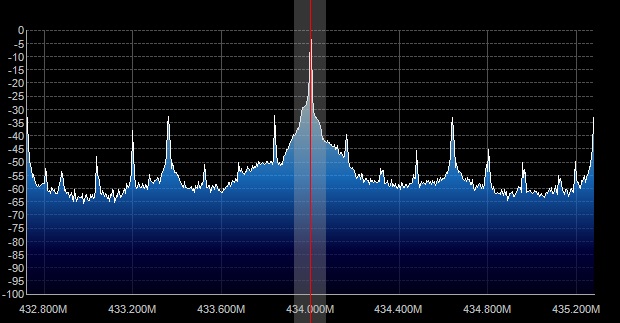
This can be seen even more clearly below, when a transmission is occurring, where we can also identify that the strongest signal is actually at 434MHz.
Analyzing the Signal
After selecting the frequency, I recorded 10 seconds of the signal which came out as an astonishingly large 110MB WAV file! Opening up the recording on Audacity, as shown below, we can identify 10 seemingly identical, equally spaced transmissions 1 second apart, with the exception of the 8th one.
We ignore the anomaly for now (as a closer inspection indicates it is simply truncated, but otherwise the same as other transmissions), and focus on an individual section:
Once more we find 10 identical transmissions within each section, so zooming further we can clearly identify the modulation as a type of on-off keying (OOK) where 0s are short HIGH bursts followed by long periods of silence, and 1s are long HIGH bursts followed by small periods of silence.
Note of course that the encoding could be reversed, but it is reasonable to assume that it is not (and our knowledge of what is being transmitted tells us we are right!): the signal appears to be 0100101001010. This is indeed what we transmitted, but there is a spurious 0 at the end. Though this could be a checksum, flipping the last bit or removing it does not alter the value, hence we can assume it is simply an End-of-Message (EOM) value. Looking at the individual signals for 0 and 1, we see that the pulse length for a 0 is 350μs long, and it is 3 times as long for a 1.
Looking at the setup code, we see that the pulse length is indeed 350μs long, and each message is repeated 10 times, each of which is followed by a sync message. Moreover, for the default protocol, a 0 is represented as 1 HIGH, 3 LOWs, while a 1 is the reverse. Success!
Recovering the Transmission with MATLAB
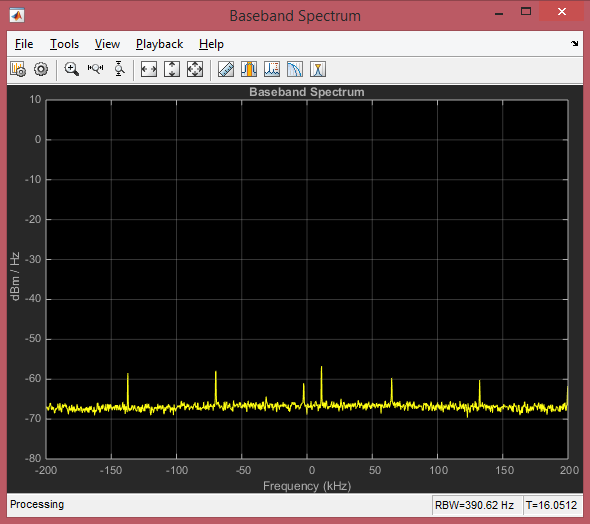
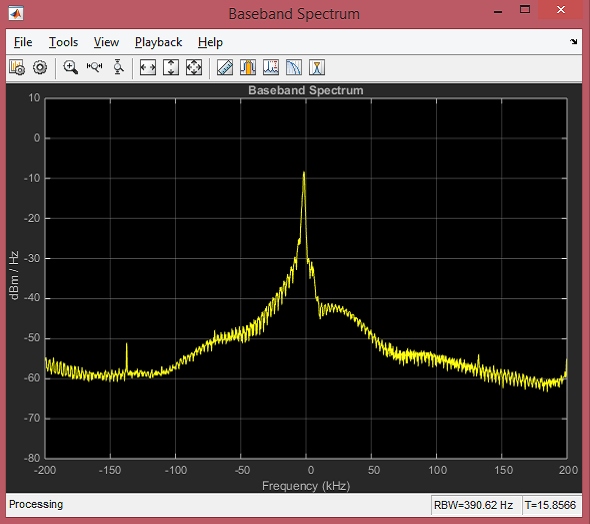
Even though rtl_433 readily decodes this message for us, when I found out that MATLAB has a package for RTL-SDR (which needs the Communications System Toolbox), I thought I'd try it out. As a first step, I tried the spectrum analyzer example, just to ensure that everything works. 433.989MHz gave the strongest signal, and behaves as expected both during silence and transmission:
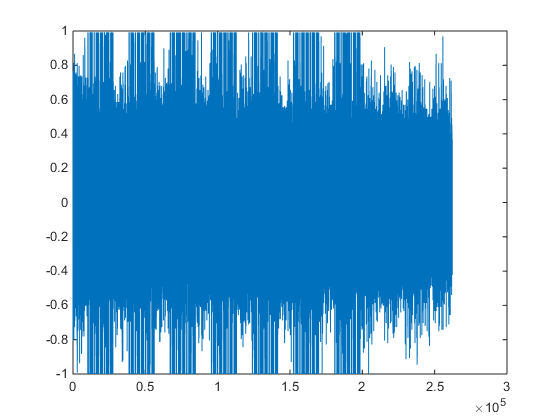
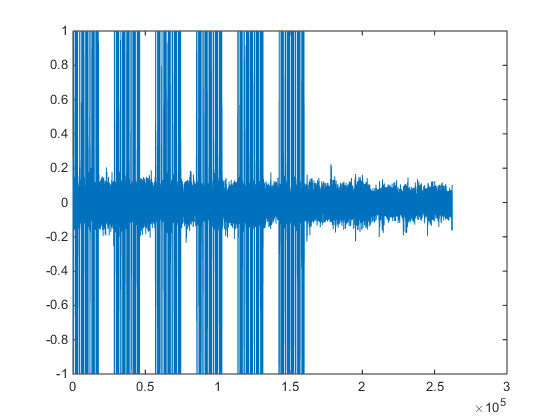
The data is output in I/Q format with values between -1 and 1, but I did not want to write a demodulator, so I instead took the real part, corresponding to the in-phase component, which proves to be sufficient for our purposes. [UPDATE: An alternative is taking the modulus of the complex value. This has the added benefit of not needing the Hilbert transform below, as this comment mentions. I can confirm that setting rdata = abs(data); and binary(smoothed >= high_thres) = 1; in the code works without further changes.] As can be seen in the figure below and left, the output is very noisy, so I immediately applied a Savitzky-Golay filter, which was chosen to be cubic for data frames of length 41, as in the MATLAB example. As the picture below and to the right shows, the filtering is very effective.
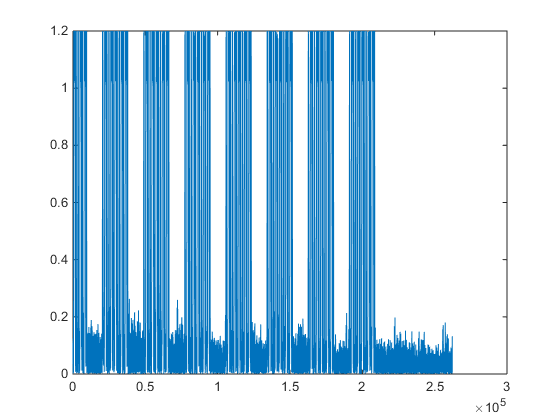
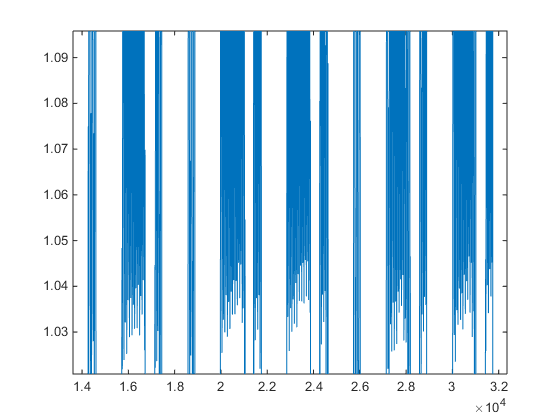
Having reduced the noise, the next step was to calculate the envelope of the signal, which in MATLAB is implemented by taking the modulus of the Hilbert transform, as also explained here. The figures below show what that looks like for the overall signal, as well as for a specific transmission of our 10 bits. As can be seen, during the transmission the envelope fluctuates a bit, but is most frequently above 1. When the transmission is not occurring, the value remains below 0.1, but this is not pictured here.
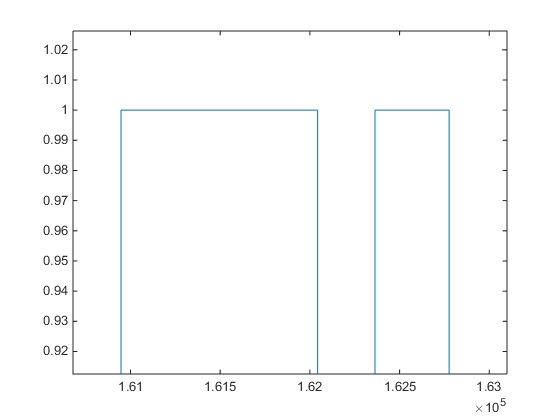
The conversion to a binary signal is straightforward: if the magnitude of the above quantity is above 0.5, the signal is considered to be at a logical HIGH, and if it is below 0.5 it is a logical LOW. Zooming into one of the transmissions shows us that the digital pulse produced is as expected, without noise:
The basic idea to automatically detect whether a signal is a 0 or 1 is simple: count the number of consecutive samples that were HIGH, and if they are close to the transmission pulse length of a 0 or a 1, print that value! There were a few intricacies in debouncing (where the code basically skips over a few LOWs in between HIGHs) and in setting the appropriate thresholds for what counts as "close enough", but in the end the code was able to accurately recover all transmitted bits. That said, I expect that changes to the parameters will need to be made for other hardware, depending on factors such as the antennas and power of transmission.
Conclusion
RTL-SDR definitely opens up many possibilities. Even though this post was a "toy example", it has real-world implications as plenty of devices operate freely at 433MHz and other frequencies, as explained in the introduction. Although MATLAB is not always easy to work with, it has tremendous capabilities, and the fact that it interfaces with the dongle is a great feature.
I believe that the RTL-SDR community would greatly benefit from more open-source projects using MATLAB, so I have made my code availabe on GitHub, if you would like to try it out for yourself. As mentioned above, it might need some tweaking based on your hardware, but I hope such changes will be minimal. If you have any comments or improvements, feel free to contact me!
Postscript
My initial plan was to use GNU Radio on my new Raspberry Pi 2, but despite its extra processing power, I found that it could not adequately do signal processing, even for FM frequencies, and often underflowed. If you are interested in going down that route, you might want to look at this post containing installation instructions, and gqrx as a *nix alternative to SDR# (it's gqrx-sdr under the repositories). Also take a look at this forum discussion if you get a BadMatch error, and at this post detailing how to approach the analysis using GNU Radio. Finally, if you, like me, don't have an Ethernet plug available, but have an Android phone that can tether (even if it is using Wi-Fi), connect it to your Pi's USB, set the connection mode to "Media" and follow the instructions here!
